
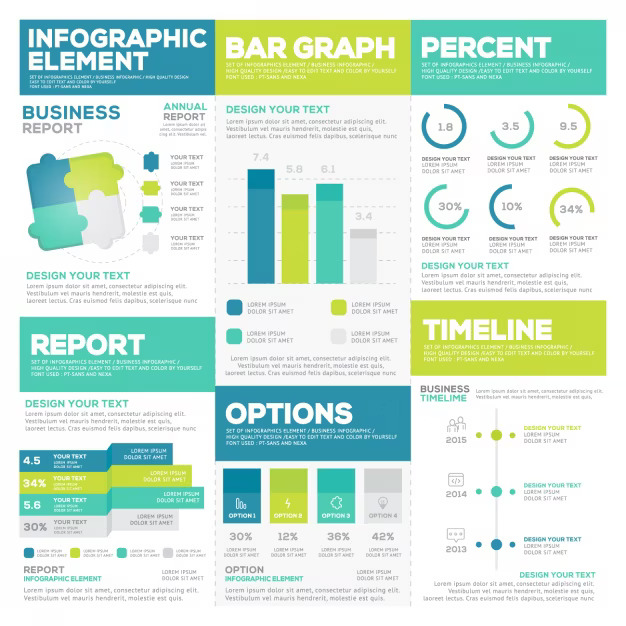
Description
Infographic & Report Templates are specialized design resources that allow individuals and organizations to present data, research, and insights in a visually compelling and easy-to-understand format. In a world overloaded with information, clarity and visual storytelling are essential for capturing attention and improving comprehension. Infographic templates combine icons, illustrations, charts, and typography to simplify complex information, making it accessible to diverse audiences. Report templates, on the other hand, provide structured layouts for longer documents such as annual reports, research papers, whitepapers, and case studies. Together, they form a powerful communication tool for professionals, educators, marketers, and corporate teams. These templates are crafted to balance aesthetics with readability, ensuring that visuals enhance rather than overwhelm the message. Users can easily insert their data, customize colors, adjust fonts, and integrate branding elements. For businesses, they streamline the reporting process by providing ready-to-use frameworks that align with corporate identity and industry standards. Infographics are highly shareable, making them perfect for presentations, websites, and social media campaigns, while reports are essential for internal and external communication with stakeholders. The benefit lies not only in saving time but also in improving the impact of the message. Visual data presentation has been proven to increase retention and engagement, making these templates a strategic asset. They are optimized for digital distribution (PDF, PowerPoint, Google Slides) as well as print, ensuring versatility across channels. By using infographic and report templates, organizations can transform raw data into powerful narratives, elevate their credibility, and make informed decisions easier to understand. Ultimately, they serve as a bridge between complex data and audience-friendly storytelling.

Sherifat –
Infographic & Report Templates completely streamlined my data presentations. What used to take days in design is now done in hours. The templates are both beautiful and intelligently structured, allowing for seamless data integration. Support was responsive and genuinely helpful with customization options.
Kiran –
Infographic & Report Templates’ transformed our daunting market research data into compelling visuals. What once took weeks of designer collaboration is now streamlined. The consistent branding and data-driven aesthetics elevated our client presentations significantly. Responsive support made customization seamless. Highly recommended!
Idorenyin –
Presenting complex market research used to be a bottleneck. Infographic & Report Templates transformed that. The templates’ visual clarity immediately elevated our reports, and the support team guided us through a tricky customization seamlessly. Data now sings, not drones. Excellent execution.
Naomi –
Before ‘Infographic & Report Templates’, our quarterly reports were a visual mess. Now, presentations are professional, impactful, and actually *read*. The templates’ clear structure and intuitive design saved us countless hours, and the support team quickly answered my specific formatting questions. A game changer for data storytelling.
Toyin –
Infographic & Report Templates” were a game-changer for simplifying our complex market analysis. We slashed report creation time by 60%, instantly conveying key findings with their polished, data-driven visuals. The team’s prompt support and design expertise elevated our presentations to a new level of clarity and impact.